As Python developers, we strive to write efficient and performant code, but understanding where our code spends its time and how it utilizes memory can be a daunting task. This is where profiling comes to the rescue. In this blog post, we'll explore the realms of code profiling and memory profiling in Python, unraveling the mysteries behind optimizing your applications.
Code Profiling:
Code profiling involves analyzing the execution time of different parts of your code to identify bottlenecks and areas for improvement. Python provides a built-in module called cProfile that helps us achieve this.
Let's consider a simple example. Imagine you have a script that calculates the sum of squares up to a certain number. In the below code I have intentionally added time.sleep for 0.1 second after every result computation.
Example:
import time

def sum_of_squares(n):
    result = 0
    for i in range(n):
        result += i ** 2
        time.sleep(0.1)
    return result
To profile this code:
import cProfile

cProfile.run('sum_of_squares(100)')
And here is the result of code profiling:

In the above image, for each line of code, we can see number of calls, total time elapsed at the specific line, time per call, cumulative time, and percentage of time / call.
In the line highlighted in red, we can see the most amunt of time & most amount of calls are spent at time.sleep function
Memory Profiling:
Similarly during memory profiling we analyze the amount of memory that is consumed at each line.
For example:
from memory_profiler import profile
import pandas as pd

@profile
def generate_squares(n):
    squares = [i**2 for i in range(n)]

    sample_df = pd.DataFrame(
    {
        'a': [1, 2, 3, 4, 5, 6, 7, 8, 9, 10],
        'b': [1, 2, 3, 4, 5, 6, 7, 8, 9, 10]
    }
    )

    return squares

if __name__ == "__main__":
    result = generate_squares(1000)
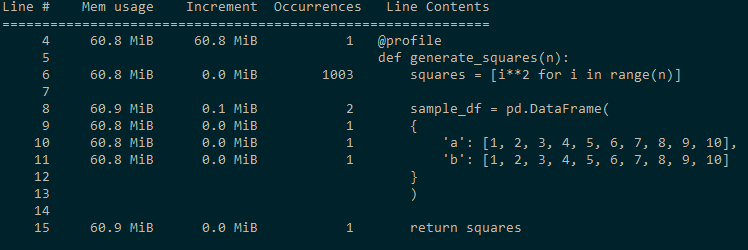
In the above code, I am creating a sample_df dataframe using pandas and when I did memory profiling these are the results.

We can see that the line where we are creating the sample pandas dataframe is consuming the highest amount of memory.
Profiling code and memory can help us in:
1 Reducing execution time
2 Identifying performance bottlenecks
3 Detect/Prevent out of memory errors
4 Optimizing memory usage